real_time_line_plotter.py source
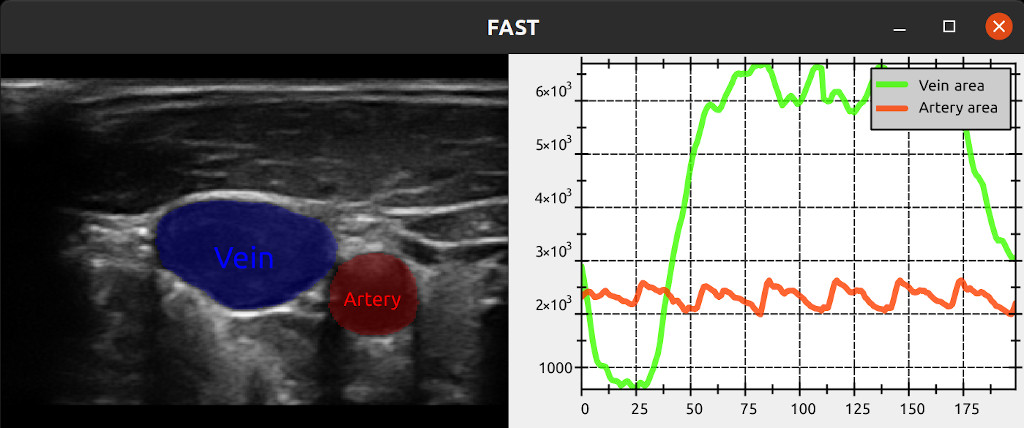
This example performs image segmentaton on a stream of ultrasound images with a neural network, calculates the area of the segmentation regions and then plots the area curves over time using the LinePlotter.
This example performs image segmentaton on a stream of ultrasound images with a neural network, calculates the area of the segmentation regions and then plots the area curves over time using the LinePlotter.
import platform
if platform.system() != 'Windows':
    import PySide2.QtSvg # Must import this before fast due to conflicting symbols
import fast # Must import FAST before rest of pyside2
from PySide2.QtWidgets import *
from shiboken2 import wrapInstance
import numpy as np

fast.downloadTestDataIfNotExists() # This will download the test data needed to run the example


class CalculateArea(fast.PythonProcessObject):
    """
    Simple process object for calculating area of a two class segmentation
    """
    def __init__(self):
        super().__init__()
        self.createInputPort(0)
        self.createOutputPort(0)
        self.createOutputPort(1)

    def execute(self):
        input = self.getInputData()
        input = np.asarray(input)
        area1 = float(np.sum(input == 1))
        area2 = float(np.sum(input == 2))

        self.addOutputData(0, fast.FloatScalar.create(area1))
        self.addOutputData(1, fast.FloatScalar.create(area2))


# Set up computation pipeline
streamer = fast.ImageFileStreamer.create(
    fast.Config.getTestDataPath() + 'US/JugularVein/US-2D_#.mhd',
    loop=True
)

# Segmentation using a neural network
segmentationNetwork = fast.SegmentationNetwork.create(
    fast.Config.getTestDataPath() + 'NeuralNetworkModels/jugular_vein_segmentation.xml',
    scaleFactor=1./255.,
).connect(streamer)

# Create area line plotting
calculateArea = CalculateArea.create() \
    .connect(segmentationNetwork)

linePlotter = fast.LinePlotter.create(bufferSize=200,style=fast.PlottingStyle_DARK) \
    .connect(calculateArea) \
    .connect(1, calculateArea, 1)
linePlotter.setNames({0: 'Artery area', 1: 'Vein area'})

# Visualization part
imageRenderer = fast.ImageRenderer.create().connect(streamer)

segmentationRenderer = fast.SegmentationRenderer.create(
    opacity=0.25,
    colors={1: fast.Color.Red(), 2: fast.Color.Blue()},
).connect(segmentationNetwork)

labelRenderer = fast.SegmentationLabelRenderer.create(
        labelNames={1: 'Artery', 2: 'Vein'},
        labelColors={1: fast.Color.Red(), 2: fast.Color.Blue()},
).connect(segmentationNetwork)

# Setup window
window = fast.SimpleWindow2D.create(bgcolor=fast.Color.Black(), width=1400, height=512)\
    .connect([imageRenderer, segmentationRenderer, labelRenderer])
window.addProcessObject(linePlotter)

# Use pyside2 to add plotting widget to the window
mainWidget = wrapInstance(int(window.getWidget()), QWidget)
layout = mainWidget.layout()
plottingWidget = wrapInstance(int(linePlotter.getPlotterWidget()), QWidget)
plottingWidget.setFixedWidth(700)
plottingWidget.setFixedHeight(512)
layout.addWidget(plottingWidget)

# Run everything!
window.run()