generate_tissue_patches_from_wsi.py source
This example loads a whole slide image (WSI), and generates a stream of patches of tissue in the WSI, and finally displays it using matplotlib.
This example loads a whole slide image (WSI), and generates a stream of patches of tissue in the WSI, and finally displays it using matplotlib
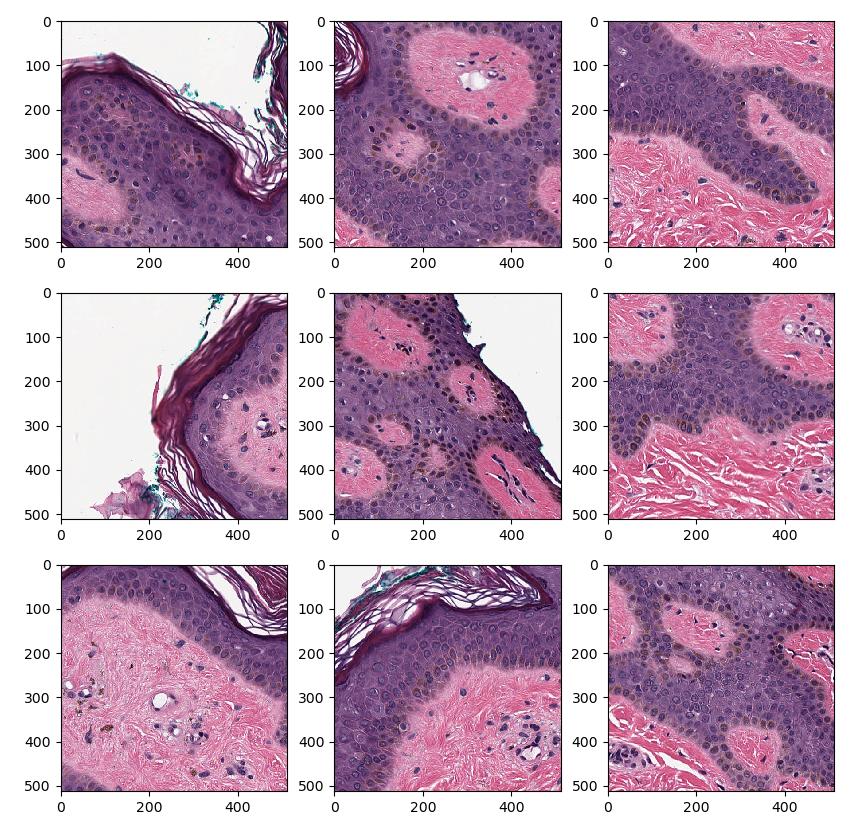
import fast
import matplotlib.pyplot as plt

# This will download the test data needed to run the example
fast.downloadTestDataIfNotExists()

importer = fast.WholeSlideImageImporter.create(
    fast.Config.getTestDataPath() + 'WSI/CMU-1.svs')

tissueSegmentation = fast.TissueSegmentation.create().connect(importer)

patchGenerator = fast.PatchGenerator.create(512, 512, level=0)\
    .connect(0, importer)\
    .connect(1, tissueSegmentation)

# Create a 3x3 subplot for every set of 9 patches
patch_list = []
for patch in fast.DataStream(patchGenerator):
    patch_list.append(patch)
    if len(patch_list) == 9:
        # Display the 9 last patches
        f, axes = plt.subplots(3,3, figsize=(10,10))
        for i in range(3):
            for j in range(3):
                axes[i, j].imshow(patch_list[i + j*3])
        plt.show()
        patch_list.clear()
        break